Glioblastoma growth and invasion: when lactate dehydrogenases take the lead

Glioblastoma growth and invasion: when lactate dehydrogenases take the lead

Glioblastoma growth and invasion: when lactate dehydrogenases take the lead 1241 1754 Metabolism & Cancer
2 Comments
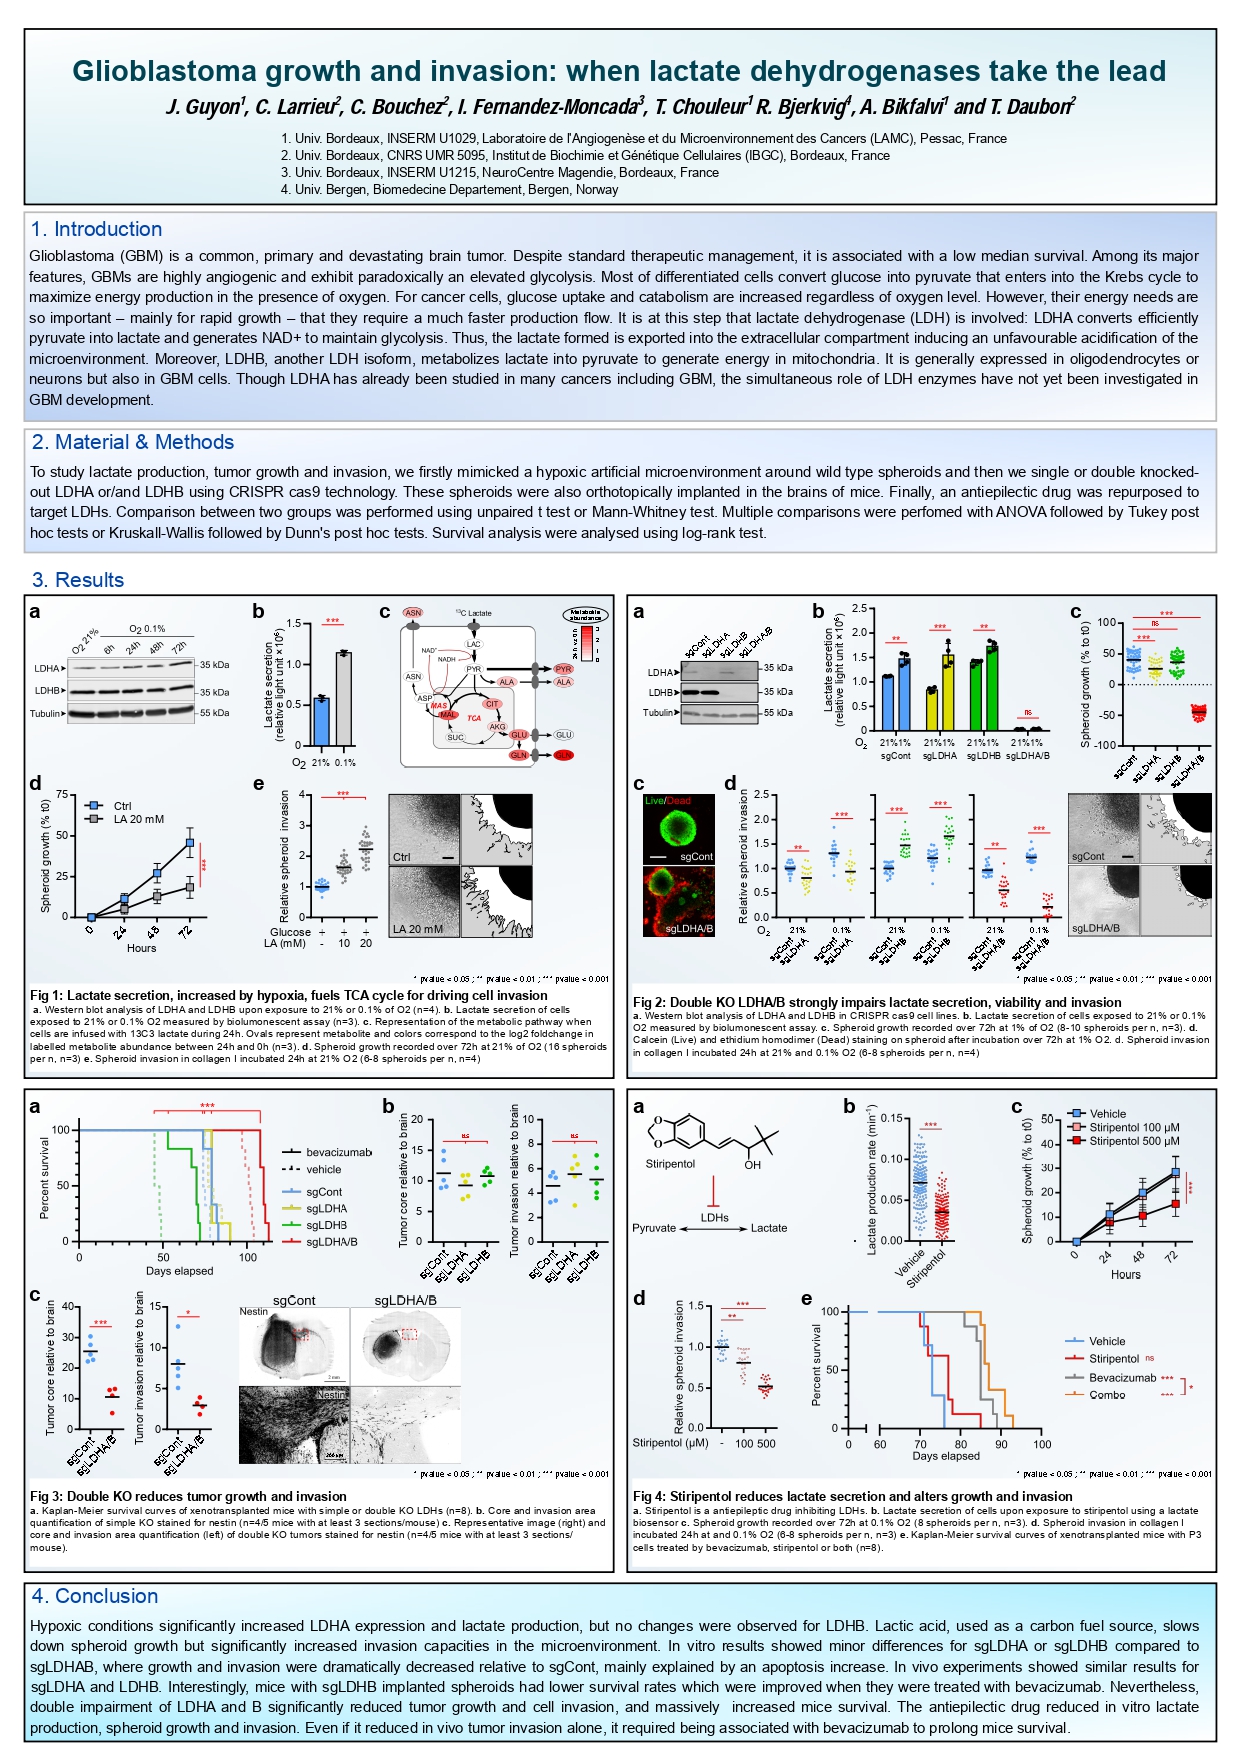
  • Good Afternoon. Firstly I want to congrat with you for your work. I want to ask you a question about the results demonstrated in figure1D and figure 1C. Can you explain me how do you evaluate spheroid growth and the spheroid invasion and how do you create spheroids?
    Thank you

    Pamela De Falco

    • Dear Pamela De Falco,

      Thank you for your question, I think you mean to refer figure 1D and 1E?

      We generated spheroids of homogeneous size from 10,000 dissociated cells using classical medium of the cells with 0.4% of methylcellulose in round-bottom 96 well plate. After 3 days, our spheroids was usable.

      The quantification was based on the Area. At T0, all spheroids have the same size.
      For the growth, we measured the area of the spheroids at T0, 24, 48 and 72h and we calculated the % of change relative to T0.
      For the invasion, we measured the total area and the core area at 24h (because there is no invasion at T0, spheroids have just been included in collagen matrix), then we calculated the invasive area as follow: (total area – core area) relative to the core area.

      You can find more details here: https://www.jove.com/t/60998/a-3d-spheroid-model-for-glioblastoma

      Best,

      Joris